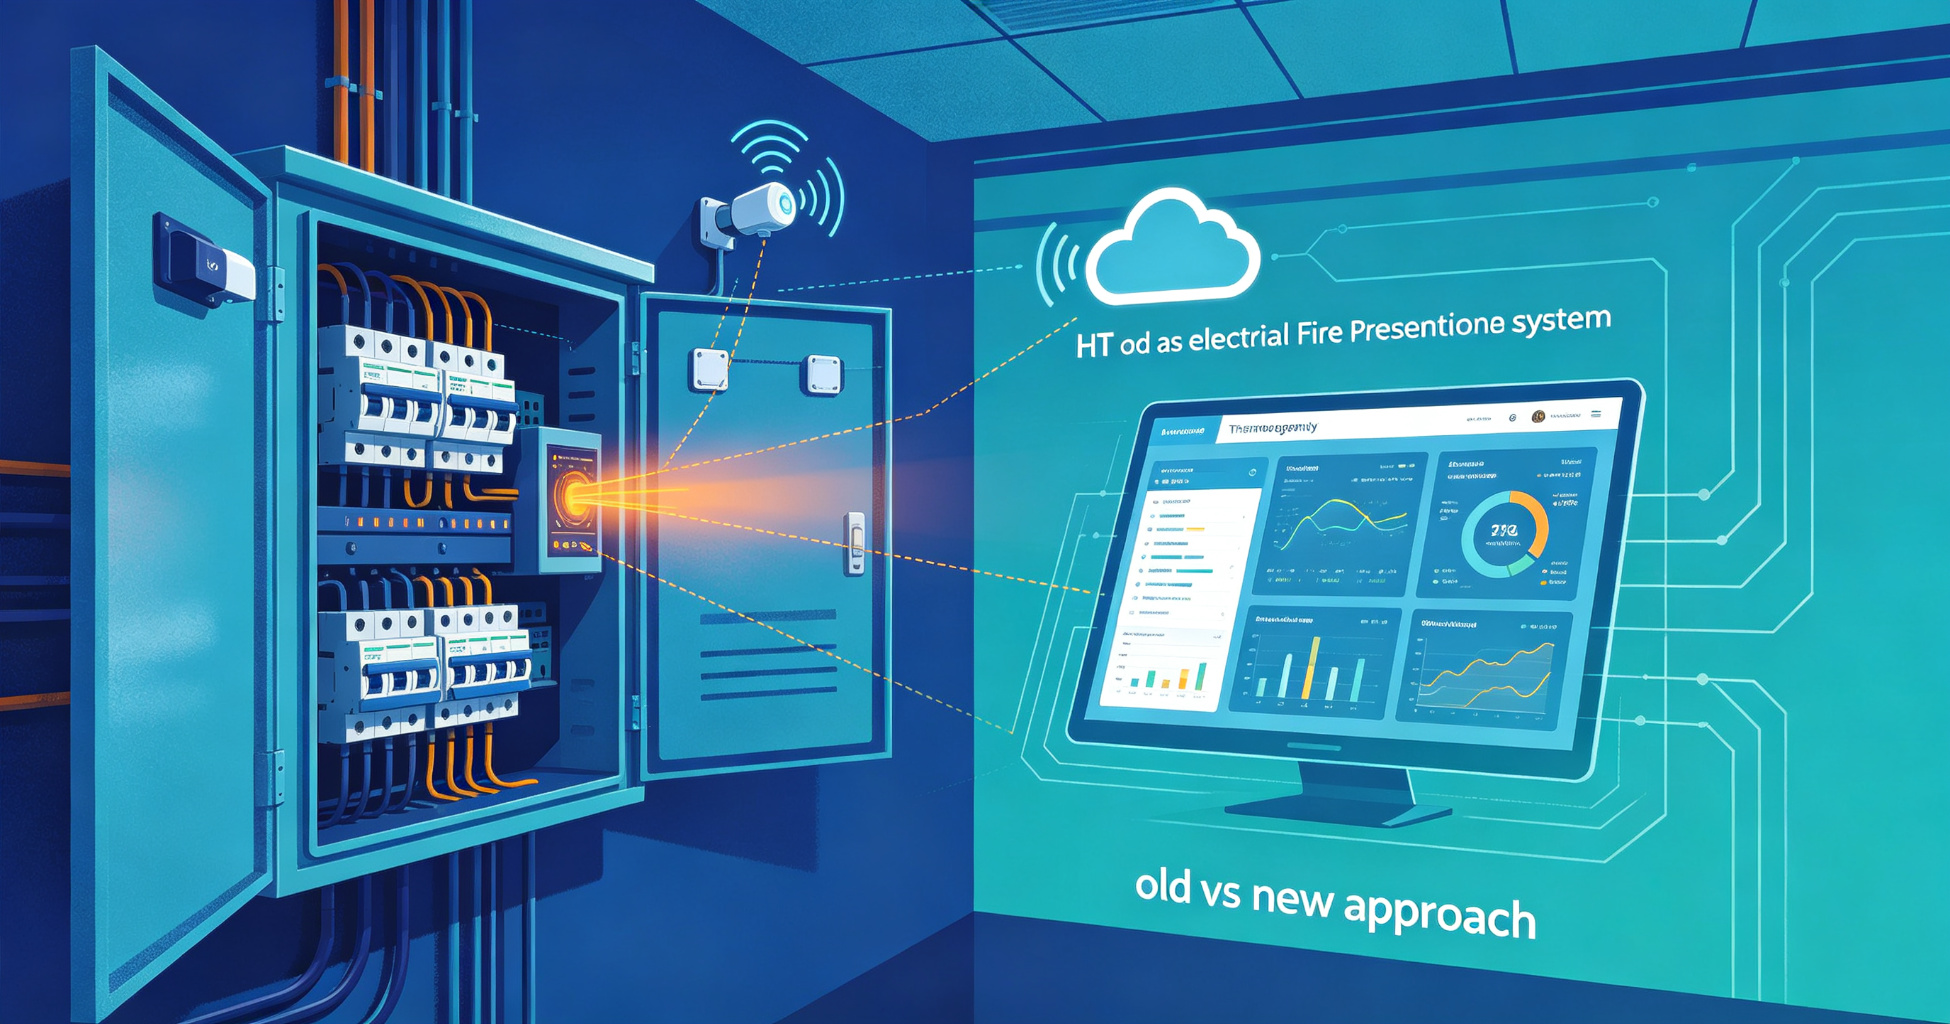
A thermal scan records one moment. Continuous IoT sensing watches the months during which a loose connection heats up.
Periodic infrared thermography is being displaced by continuous IoT monitoring for electrical fire prevention. The shift is driven by cost, coverage, and a fundamental limitation: a thermal scan captures one moment, while failures develop over months. Continuous sensing catches what a quarterly inspection cannot.
The Structural Gap in Periodic Thermography
Infrared thermography has been the workhorse of electrical preventive maintenance since the 1980s. The method is well understood: a certified thermographer scans energized equipment, identifies hot spots, and flags connections or components running above expected temperature. NFPA 70B treats it as a core component of an electrical preventive maintenance program, and for good reason. It works. The problem is not capability. It is cadence.
Consider what a thermographic inspection actually covers. A facility with 2,000 electrical panels might schedule annual or semi-annual scans. A thermographer can realistically inspect 80 to 120 panels per day under good conditions. That means the entire site is covered in roughly 20 working days, spread across a year. Each panel gets perhaps 3 to 8 minutes of attention. The other 8,700 hours of the year, that panel is unobserved.
Electrical failures do not announce themselves on a schedule. Loose connections, corrosion, and insulation degradation develop gradually. A connection that reads 15°C above ambient in January may read 60°C above ambient in July under higher load. If the scan happens in February, the problem is missed. By the time the next scan arrives, the window for planned intervention has closed.
The fundamental limitation of periodic thermography is not detection capability. It is the probability that a developing fault exists during the inspection window. For a fault with a 90-day development cycle and an annual scan interval, that probability is roughly 25%.
This is not a criticism of thermographers. It is a statistical property of sampling a continuous process at discrete intervals. The same logic applies to vibration analysis, oil sampling, and every other periodic diagnostic method. The question is whether continuous alternatives now exist that are cost-effective enough to replace or supplement the periodic approach.
What Changed: Sensing, Connectivity, and Cost
Three converging trends made continuous electrical monitoring practical at scale.
Sensor costs collapsed
Temperature sensors suitable for switchgear applications — thermocouples, RTDs, and infrared thermopiles — have dropped in unit cost by roughly 60% over the past decade. More significantly, the cost of the signal conditioning, digitization, and wireless transmission around each sensor has fallen even faster. A self-powered wireless temperature sensor that cost $400 in 2015 now costs under $80 at volume. That changes the economics of instrumenting every busbar joint, breaker terminal, and cable lug in a facility.
Current and arc fault sensing became integrated
Temperature alone is a lagging indicator. By the time a connection heats up, degradation is already advanced. Modern monitoring platforms combine temperature with current sensing and, increasingly, arc fault detection. The combination catches problems earlier: a loose connection shows up as anomalous current signature before it generates measurable heat. Companies including Chilion offer IoT-based electrical safety platforms that combine current, temperature, and arc fault sensing in a single monitored node, which is a meaningful advance over temperature-only monitoring.
Wireless mesh and cellular backhaul eliminated wiring costs
The historical objection to continuous monitoring was installation cost. Running conduit and signal cable to every panel in a facility could exceed the cost of the monitoring equipment itself. Wireless mesh protocols (Zigbee, Thread, and proprietary sub-GHz variants) and low-power cellular (LTE-M, NB-IoT) removed that barrier. A monitoring node can now be installed in 15 to 30 minutes without de-energizing the panel. For a 2,000-panel facility, that is a deployment measured in weeks, not months.
Standards and Codes Are Catching Up
Regulatory frameworks have begun to accommodate continuous monitoring. NFPA 70B (2023 edition) explicitly recognizes continuous monitoring as a valid alternative to periodic inspection for certain equipment classes, provided the monitoring system meets specified performance criteria. This is a significant change from earlier editions, which assumed periodic inspection as the default.
IEC 62443 addresses cybersecurity requirements for industrial monitoring systems, which matters because a networked electrical monitoring system is an attack surface. UL 489 and UL 1077 define the performance requirements for the circuit protection devices that monitoring systems increasingly integrate with. EN 50110 governs safe operation of electrical installations in Europe and now references remote monitoring as a means of reducing personnel exposure to energized equipment.
The direction is consistent: standards bodies are moving from "inspect periodically" to "monitor continuously, inspect when indicated." That shift has downstream effects on staffing, training, and the economics of electrical safety programs.
The Economics: Where Continuous Monitoring Wins
Periodic thermography is not cheap. A certified thermographer costs $1,200 to $2,500 per day depending on region and scope. A full facility scan for a mid-size industrial site runs $15,000 to $40,000 per year, plus the cost of the electrical contractor who opens panels and the production downtime associated with access.
Continuous monitoring has a different cost structure: higher upfront capital, lower recurring cost. A 500-node deployment might cost $60,000 to $120,000 installed, with annual software and maintenance fees of 10% to 15% of capital. Over a five-year horizon, the total cost of ownership is comparable. The difference is coverage: 500 nodes monitored 8,760 hours per year versus 500 panels inspected 4 to 8 hours per year.
The case strengthens when you account for avoided losses. A single switchgear fire can cause $500,000 to $5 million in direct damage, plus business interruption. Insurance carriers have noticed. Several major commercial insurers now offer premium reductions of 5% to 15% for facilities with certified continuous electrical monitoring, recognizing the reduced loss frequency.
What This Means for Facility Managers and Engineers
The practical question is not whether to adopt continuous monitoring, but how to sequence the transition. Three approaches are emerging:
- Hybrid: Keep annual thermographic scans for high-value, low-node-count equipment, and deploy continuous monitoring on the panels and switchgear with the highest consequence of failure. This is the most common approach in 2024-2025.
- Risk-ranked replacement: Instrument the top 20% of assets by criticality and failure probability, then expand coverage as budget allows. Electrical risk assessment methodologies provide the ranking framework.
- Full deployment: Monitor everything from the start. Justified for data centers, hospitals, and continuous-process facilities where any unplanned outage is unacceptable.
The transition also changes the skill profile of the electrical maintenance team. Thermography certification remains valuable, but the growing need is for engineers who can interpret time-series data, tune alarm thresholds, and integrate monitoring output into a computerized maintenance management system. Predictive maintenance programs that were built around periodic inspection schedules need to be rebuilt around continuous data streams.
Future Projections
Three projections are reasonable based on current adoption curves.
First, by 2030, continuous electrical monitoring will be the default for new construction in mission-critical facilities. The incremental cost of embedding sensors during construction is 30% to 50% lower than retrofit, and the code environment is moving in that direction.
Second, periodic thermography will not disappear. It will shift from a routine inspection method to a diagnostic tool used when continuous monitoring flags an anomaly. The thermographer's role changes from scanning everything to investigating specific problems, which is arguably a better use of their expertise.
Third, the data generated by continuous monitoring will feed into broader building management and fire safety systems. Arc fault signatures, temperature trends, and load profiles are useful inputs for fire risk models, and integration with fire alarm and suppression systems is already happening in new deployments.
The replacement of periodic thermography by IoT-based monitoring is not a question of whether, but how quickly. The technology is mature, the standards are aligning, and the economics work for most industrial and commercial facilities. The remaining barrier is organizational inertia, which tends to resolve itself the first time a continuous system catches a fault that a periodic scan would have missed.
Need a passive fire protection assessment?
Our editorial team covers enclosure fire suppression, electrical safety monitoring, and fire-resistant coatings. Talk to our partners about your specific application.
Frequently Asked Questions
Does IoT monitoring replace thermography entirely?
For most routine inspection purposes, yes. Continuous monitoring provides better coverage at comparable five-year cost. However, thermography remains valuable as a diagnostic tool when monitoring flags an anomaly, and for equipment not suited to permanent instrumentation. Most facilities will operate a hybrid model for the next 5 to 10 years before continuous monitoring becomes the sole routine method.
What standards govern continuous electrical monitoring?
NFPA 70B (2023) recognizes continuous monitoring as a valid maintenance approach. IEC 62443 covers cybersecurity for the monitoring system. UL 489 and UL 1077 apply to integrated circuit protection. EN 50110 addresses safe operation in Europe. The standards landscape is evolving rapidly, and specifiers should confirm current editions and local amendments before finalizing a monitoring deployment.
What is the typical payback period for a continuous monitoring deployment?
For a mid-size industrial facility, payback typically runs 2 to 4 years when accounting for reduced inspection costs, avoided downtime, and insurance premium reductions. Facilities with high consequence of failure or recent electrical incidents see shorter paybacks. The calculation should include the avoided cost of a single significant event, which often exceeds the entire deployment cost.
How does continuous monitoring handle nuisance alarms?
Early systems generated excessive false positives from ambient temperature swings and load variation. Modern platforms use adaptive thresholds, load-compensated temperature baselines, and multi-parameter correlation to reduce nuisance alarms. A well-tuned system should generate fewer than 5 actionable alerts per 100 nodes per year, with most alerts resolving to either a confirmed fault or a documented environmental cause.